PREMIUM

Lunch Bar Graph & Tally Chart

Overview

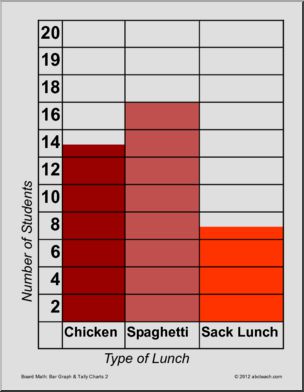
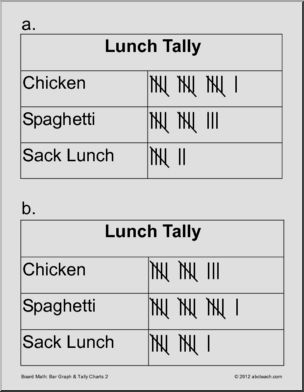
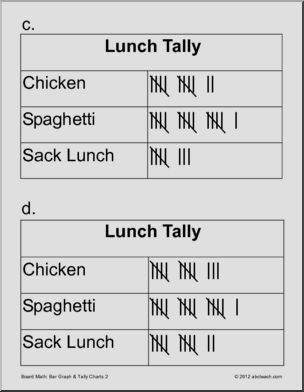
This Lunch Bar Graph & Tally Chart is perfect to practice graphing skills. Your elementary grade students will love this Lunch Bar Graph & Tally Chart. An enlarged version of abcteach’s Lunch Bar Graph and Tally Chart file. Graph measures the number of students who choose chicken, spaghetti or sack lunch.

To access this content, you must purchase a subscription. Subscribe Now!

Media pdf

Download

Similar Resources

PREMIUM

Content / Common Core Standards / Math / Grade 3 / Geometry

Media pdf

PREMIUM

Content / Middle School/Junior High / Math / Algebra

Media pdf

PREMIUM

Content / Holiday/Seasonal / Holidays / Solstice and Equinox

Media pdf

Privacy Overview
abcteach

This website uses cookies so that we can provide you with the best user experience possible. Cookie information is stored in your browser and performs functions such as recognising you when you return to our website and helping our team to understand which sections of the website you find most interesting and useful.

Strictly Necessary Cookies

Strictly Necessary Cookie should be enabled at all times so that we can save your preferences for cookie settings.