PREMIUM

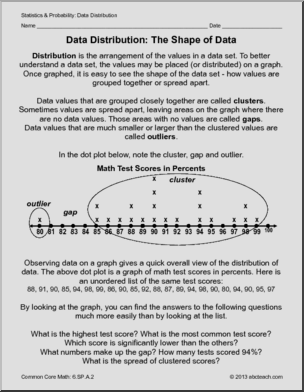
Common Core: Data Distribution – The Shape of Data (grade 6)

Overview

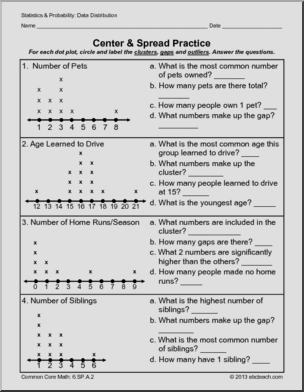
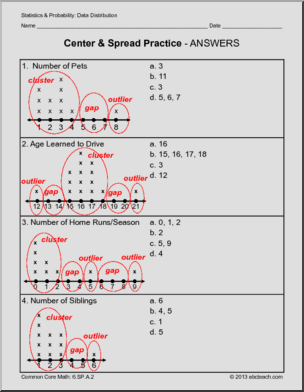
Rules and practice covers data distribution and the shape a data set creates when graphed. Dot plots are used to identify clusters, gaps and outliers. CC: Math: 6.SP.A.2

To access this content, you must purchase a subscription. Subscribe Now!

Media pdf

Download

Similar Resources

PREMIUM

Content / Math / Decimals

Media pdf

PREMIUM

Content / Common Core Standards / Math / Common Core Math Posters

Media pdf

PREMIUM

Content / Math / Basic Math Skills / Division

Media pdf

Privacy Overview
abcteach

This website uses cookies so that we can provide you with the best user experience possible. Cookie information is stored in your browser and performs functions such as recognising you when you return to our website and helping our team to understand which sections of the website you find most interesting and useful.

Strictly Necessary Cookies

Strictly Necessary Cookie should be enabled at all times so that we can save your preferences for cookie settings.