Average Temperature (elem) Line Graph
Overview
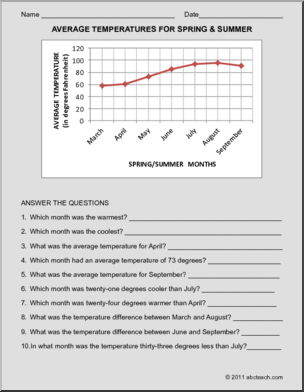
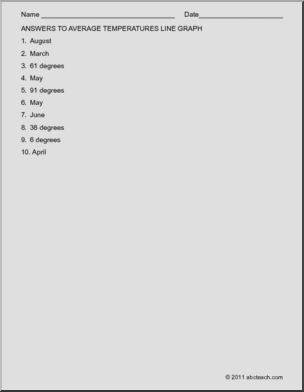
This Average Temperature (elem) Line Graph is perfect to practice graphing skills. Your elementary grade students will love this Average Temperature (elem) Line Graph. A line graph that illustrates average temperatures for spring and summer months with a set of ten questions on the same page, plus an answer sheet.
Media pdf
Similar Resources

Content / Pre-K & Early Elementary / Math Concepts / Addition
Media pdf

Content / Pre-K & Early Elementary / Math Concepts / Counting / booklets
Media pdf

Content / Teaching Extras / Activity Mats
Media pdf